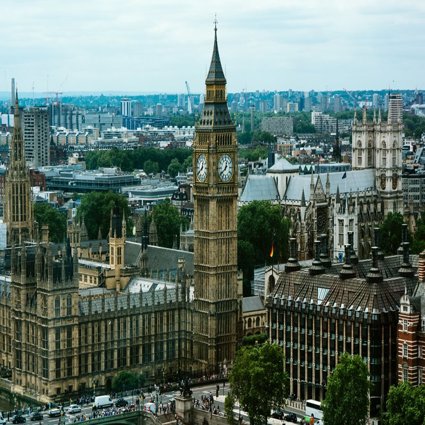
Famous football cities
In this lesson pupils use explore link between football and places to learn more about the geography and history of England’s cities
Key questions
What happened during the Industrial Revolution in the UK? When did it take place?
How and why did towns/cities grow during this period of industrial growth?
What types of industries were successful?
How did the UK landscape change as a result?
What is the link between football and industry in many UK cities?
What are the main types of work in these cities today?
What has caused the change?
What does the modern city landscape look like? Why is this?
Web Links
-
To watch a video clip on ‘Transport in Britain since 1930’ go to the BBC education web page
-
To research the association between other UK towns and industries: see ‘The Beautiful History of Club Crests, Club Colours & Nicknames’
Learning Objective
To understand the development of the UK’s cities through time, and the reasons for their population growth.
Starter
Pupils, in pairs, read the article on Tom Finney’s early footballing career: Tom Finney Roleplay exercise (see downloadable resources). Create a role-play to illustrate the work conditions of professional footballers in the 1940s and Tom Finney’s commitment to Pilkington’s Plumbers and the town of Preston.
Main Activity
Use the Famous Football Cities PowerPoint presentation (see downloadable resources) to guide the sequence of the lesson. Display the various maps showing the cities of the United Kingdom, and ask pupils to name a one city or more from each of the UK’s four constituent countries.
Discuss the populations of each of the UK cities; ask pupils if they can work out the difference between the cities with the largest and smallest populations. Ask pupils why they think London’s population is so much greater than the other cities of the UK; what is it about London that attracts people?
City Country Pop. (Millions)
London England 8.25
Birmingham England 1.09
Glasgow Scotland 0.6
Liverpool England 0.55
Bristol England 0.53
Sheffield England 0.52
Manchester England 0.51
Leeds England 0.47
Edinburgh Scotland 0.46
Leeds England 0.44
Cardiff Wales 0.35
Belfast N.Ireland 0.33
Explain that since the late 18th century, there has been population growth in the UK’s cities due to the following key reasons:
-
The Industrial Revolution (late 18th C) as people migrated from rural areas to work in factories.
-
The growth of the railway network
-
Specialisation of industry e.g. Birmingham (Brass)
By the 1930s, there were a million cars on the road in Britain. The development of motor transport changed the way people lived and worked and had an equally big impact upon the railways, signalling the end of their greatest days.
For a video clip on ‘Transport in Britain since 1930’ see this clip.
Highlight that since 1950 there has been a process of ‘suburbanisation’, whereby people are leaving the inner city and moving to live in the suburbs. There is also decentralization of retailing/entertainment owing to increased car ownership and city centre congestion
Follow the PowerPoint presentation to teach pupils about the nicknames or various football teams in the UK, and the in-depth case study of Sheffield in the past and present.
In groups of four, pupils sort historical materials for Sheffield from the Sheffield Industry resource pack (see downloadable resources) to create an industrial timeline to show how their city’s economic activity has evolved over time.
Plenary
Pupils share their work and construct symbols of ‘Industrial Heritage’ and ‘Present Employment’ and post on the ‘UK Class Map’ as a whole class.
File nameFiles
File type
Size
Download
